Application performance monitoring#
Standard monitoring service#
To monitor the availability of Blitz Identity Provider applications, invoke the /blitz/metrics service via HTTP GET. It is recommended that the service be available on each application server via HTTP when invoked from the monitoring servers located in the internal network and unavailable from external networks and user workstations.
If an application is available, the /blitz/metrics service will return its detailed performance metrics in the Prometheus format.
Example of the service response
# HELP blitz_idp_uptime_seconds Uptime
# TYPE blitz_idp_uptime_seconds gauge
blitz_idp_uptime_seconds{blitz_host="papp01.loc",} 63859.0
# HELP blitz_idp_licence_exp_seconds Licence expiration
# TYPE blitz_idp_licence_exp_seconds gauge
blitz_idp_licence_exp_seconds{blitz_host="papp01.loc",} 9.223372036854776E18
# HELP blitz_idp_config_mtime Last time, a file was changed
# TYPE blitz_idp_config_mtime gauge
# HELP blitz_idp_datasource_latency Latency of an datasource operation
# TYPE blitz_idp_datasource_latency histogram
blitz_idp_datasource_latency_bucket{blitz_host="papp01.loc",ds_type="ldap",ds_name="389-ds",op_type="read",le="0.005",} 13.0
…
blitz_idp_datasource_latency_bucket{blitz_host="papp01.loc",ds_type="ldap",ds_name="389-ds",op_type="read",le="+Inf",} 29.0
blitz_idp_datasource_latency_count{blitz_host="papp01.loc",ds_type="ldap",ds_name="389-ds",op_type="read",} 29.0
blitz_idp_datasource_latency_sum{blitz_host="papp01.loc",ds_type="ldap",ds_name="389-ds",op_type="read",} 0.3112787189999999
# HELP blitz_idp_mq_connections Amount connections to datasource
# TYPE blitz_idp_mq_connections gauge
blitz_idp_mq_connections{blitz_host="papp01.loc",mq_type="rmq",mq_server="pmq01.loc_5672",} 1.0
# HELP blitz_idp_mq_latency Latency of an mq operation
# TYPE blitz_idp_mq_latency histogram
blitz_idp_mq_latency_bucket{blitz_host="papp01.loc",mq_type="rmq",mq_server="pmq01.loc_5672",broker="blitz.events.direct",op_type="write",le="0.005",} 1.0
…
blitz_idp_mq_latency_bucket{blitz_host="papp01.loc",mq_type="rmq",mq_server="pmq01.loc_5672",broker="blitz.events.direct",op_type="write",le="+Inf",} 3.0
blitz_idp_mq_latency_count{blitz_host="papp01.loc",mq_type="rmq",mq_server="pmq01.loc_5672",broker="blitz.events.direct",op_type="write",} 3.0
blitz_idp_mq_latency_sum{blitz_host="papp01.loc",mq_type="rmq",mq_server="pmq01.loc_5672",broker="blitz.events.direct",op_type="write",} 0.028808135999999998
# HELP blitz_idp_authn_method_app_total Amount of method authentications by app id
# TYPE blitz_idp_authn_method_app_total counter
blitz_idp_authn_method_app_total{blitz_host="papp01.loc",app_id="_blitz_profile",method="sms",status="success",} 2.0
blitz_idp_authn_method_app_total{blitz_host="papp01.loc",app_id="_blitz_profile",method="cls",status="other_error",} 7.0
blitz_idp_authn_method_app_total{blitz_host="papp01.loc",app_id="_blitz_profile",method="password",status="success",} 4.0
blitz_idp_authn_method_app_total{blitz_host="papp01.loc",app_id="_blitz_profile",method="knownDevice",status="other_error",} 3.0
# HELP blitz_idp_authn_method_total Amount of authentications by a method
# TYPE blitz_idp_authn_method_total counter
blitz_idp_authn_method_total{blitz_host="papp01.loc",method="password",status="success",} 4.0
blitz_idp_authn_method_total{blitz_host="papp01.loc",method="knownDevice",status="other_error",} 3.0
blitz_idp_authn_method_total{blitz_host="papp01.loc",method="cls",status="other_error",} 7.0
blitz_idp_authn_method_total{blitz_host="papp01.loc",method="sms",status="success",} 2.0
# HELP blitz_idp_authn_method_latency Latency of an authentication method
# TYPE blitz_idp_authn_method_latency histogram
blitz_idp_authn_method_latency_bucket{blitz_host="papp01.loc",method="sms",le="1.0",} 0.0
…
blitz_idp_authn_method_latency_bucket{blitz_host="papp01.loc",method="sms",le="+Inf",} 2.0
blitz_idp_authn_method_latency_count{blitz_host="papp01.loc",method="sms",} 2.0
blitz_idp_authn_method_latency_sum{blitz_host="papp01.loc",method="sms",} 28.686999999999998
blitz_idp_authn_method_latency_bucket{blitz_host="papp01.loc",method="password",le="1.0",} 0.0
…
blitz_idp_authn_method_latency_bucket{blitz_host="papp01.loc",method="password",le="+Inf",} 4.0
blitz_idp_authn_method_latency_count{blitz_host="papp01.loc",method="password",} 4.0
blitz_idp_authn_method_latency_sum{blitz_host="papp01.loc",method="password",} 1835.901
# HELP blitz_idp_datasource_connections Amount connections to datasource
# TYPE blitz_idp_datasource_connections gauge
blitz_idp_datasource_connections{blitz_host="papp01.loc",ds_type="ldap",ds_name="389-ds",} 10.0
# HELP blitz_idp_version Application version
# TYPE blitz_idp_version gauge
blitz_idp_version{blitz_host="papp01.loc",part="major",} 5.0
blitz_idp_version{blitz_host="papp01.loc",part="minor",} 16.0
blitz_idp_version{blitz_host="papp01.loc",part="patch",} 1.0
# HELP blitz_idp_notify_user_total Amount of user notifications by channel
# TYPE blitz_idp_notify_user_total counter
blitz_idp_notify_user_total{blitz_host="papp01.loc",channel="email",} 3.0
blitz_idp_notify_user_total{blitz_host="papp01.loc",channel="sms",} 4.0
blitz_idp_notify_user_total{blitz_host="papp01.loc",channel="push",} 2.0
The name of each metric begins with the application name (the hyphen in the name is replaced by an underscore): blitz_idp_%%%, blitz_registration_%%%, blitz_recovery_%%%, blitz_console_%%%. The list of available metrics is given in the table.
Blitz Identity Provider performance metrics
Access rights |
Type |
Description |
|---|---|---|
uptime_seconds |
gauge |
Time since application start (in seconds) |
licence_exp_seconds |
gauge |
Time until license expires (in seconds) |
config_mtime |
gauge |
Timestamp of configuration file last update |
datasource_latency |
histogram |
Response delays for read and write operations from the account storage ( |
mq_connections |
gauge |
Number of connections to MQ ( |
mq_latency |
histogram |
Response delays from MQ ( |
authn_method_app_total |
counter |
Number of successful and unsuccessful authentications into different applications for each login method |
authn_method_total |
counter |
Total number of successful and unsuccessful authentications for different methods |
authn_method_latency |
histogram |
Authentication duration for different login methods |
datasource_connections |
gauge |
Number of connections to storages |
version |
gauge |
Application version |
notify_user_total |
counter |
Number of notifications sent via different channels |
authn_method_app_created |
service metrics |
These metrics (with the |
authn_method_created |
||
authn_method_latency_created |
||
datasource_latency_created |
||
mq_latency_created |
||
notify_user_created |
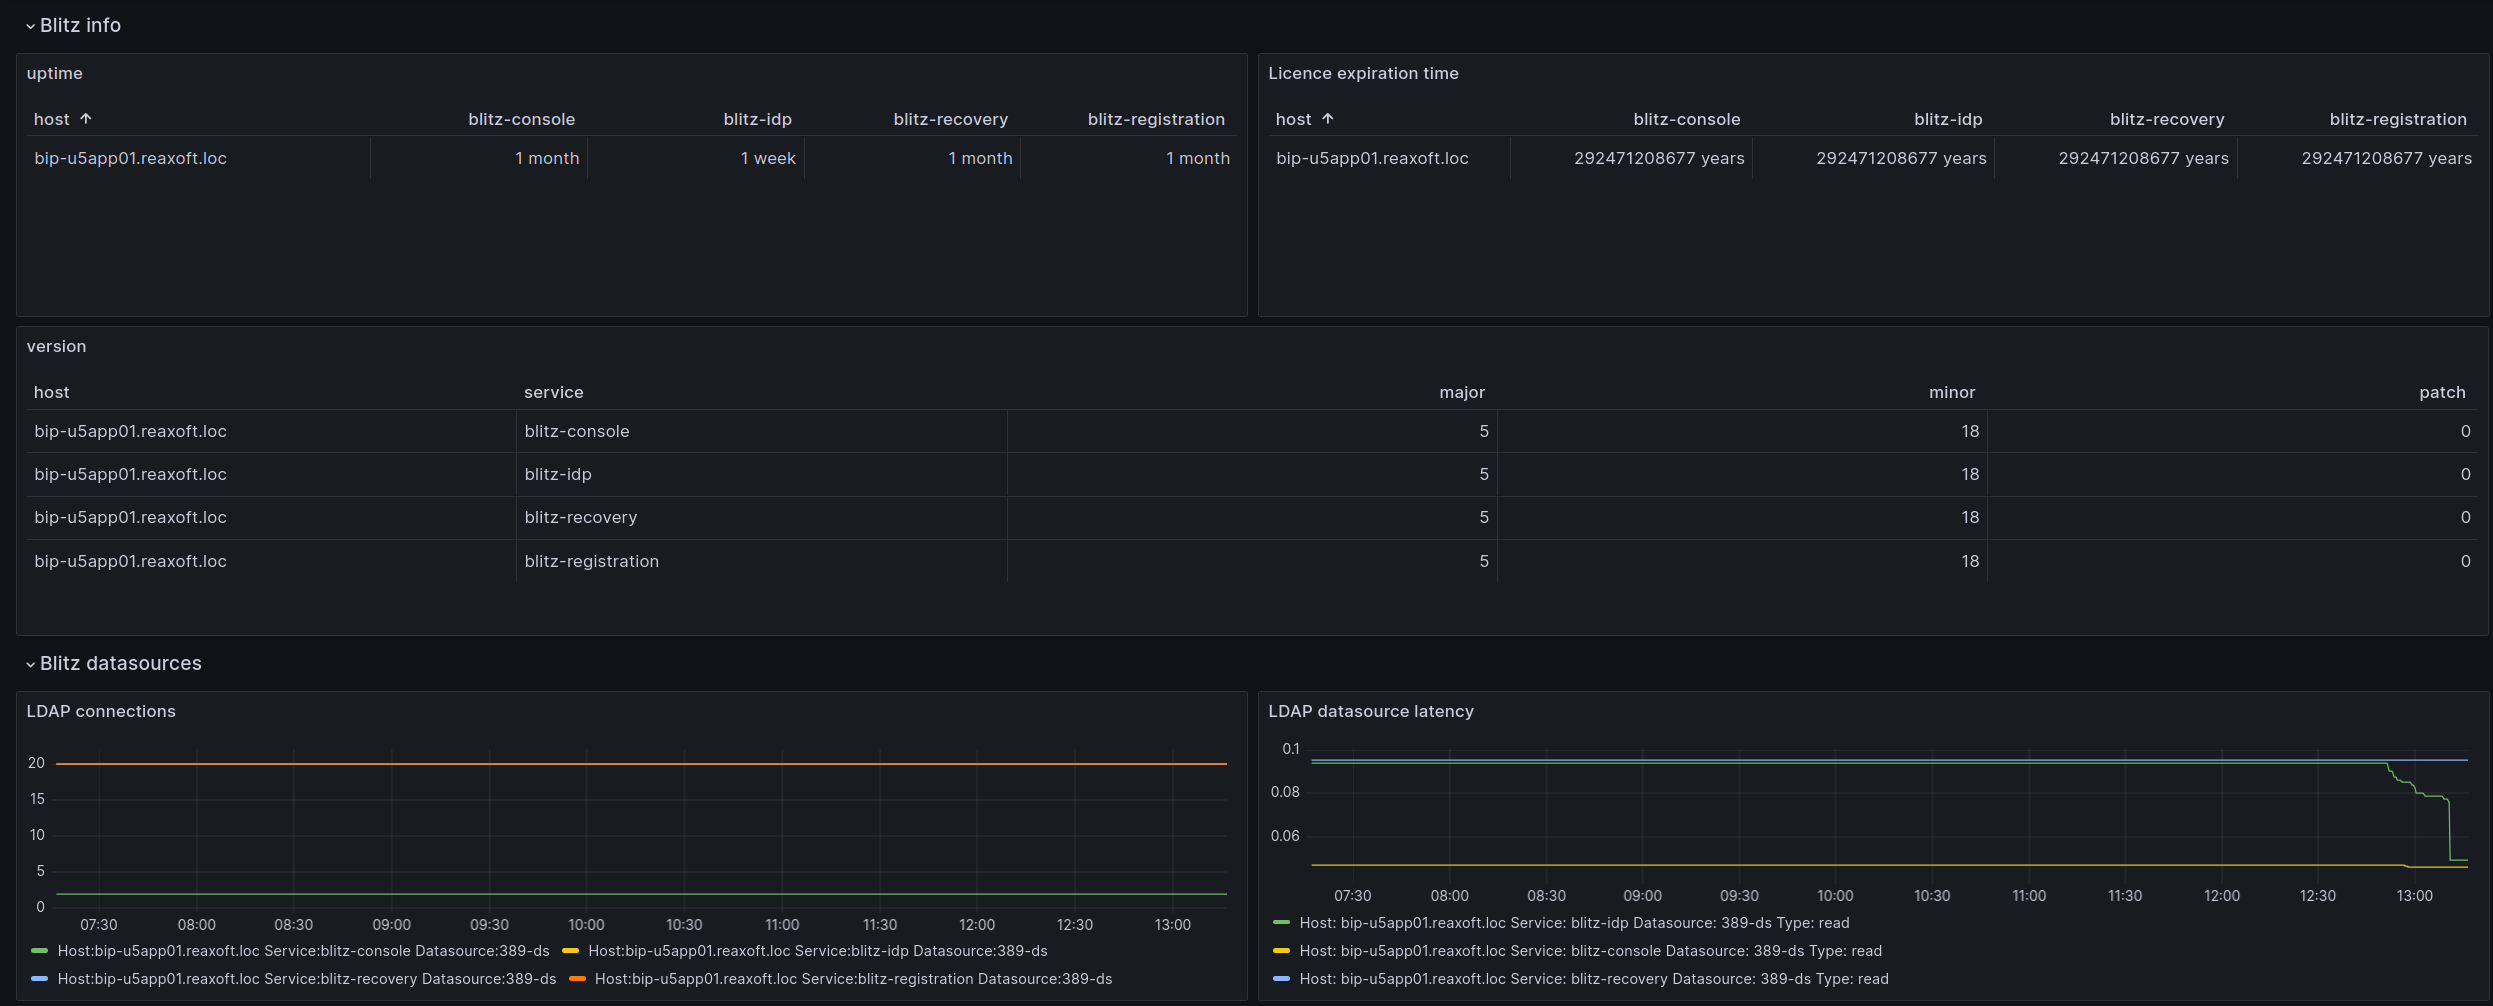
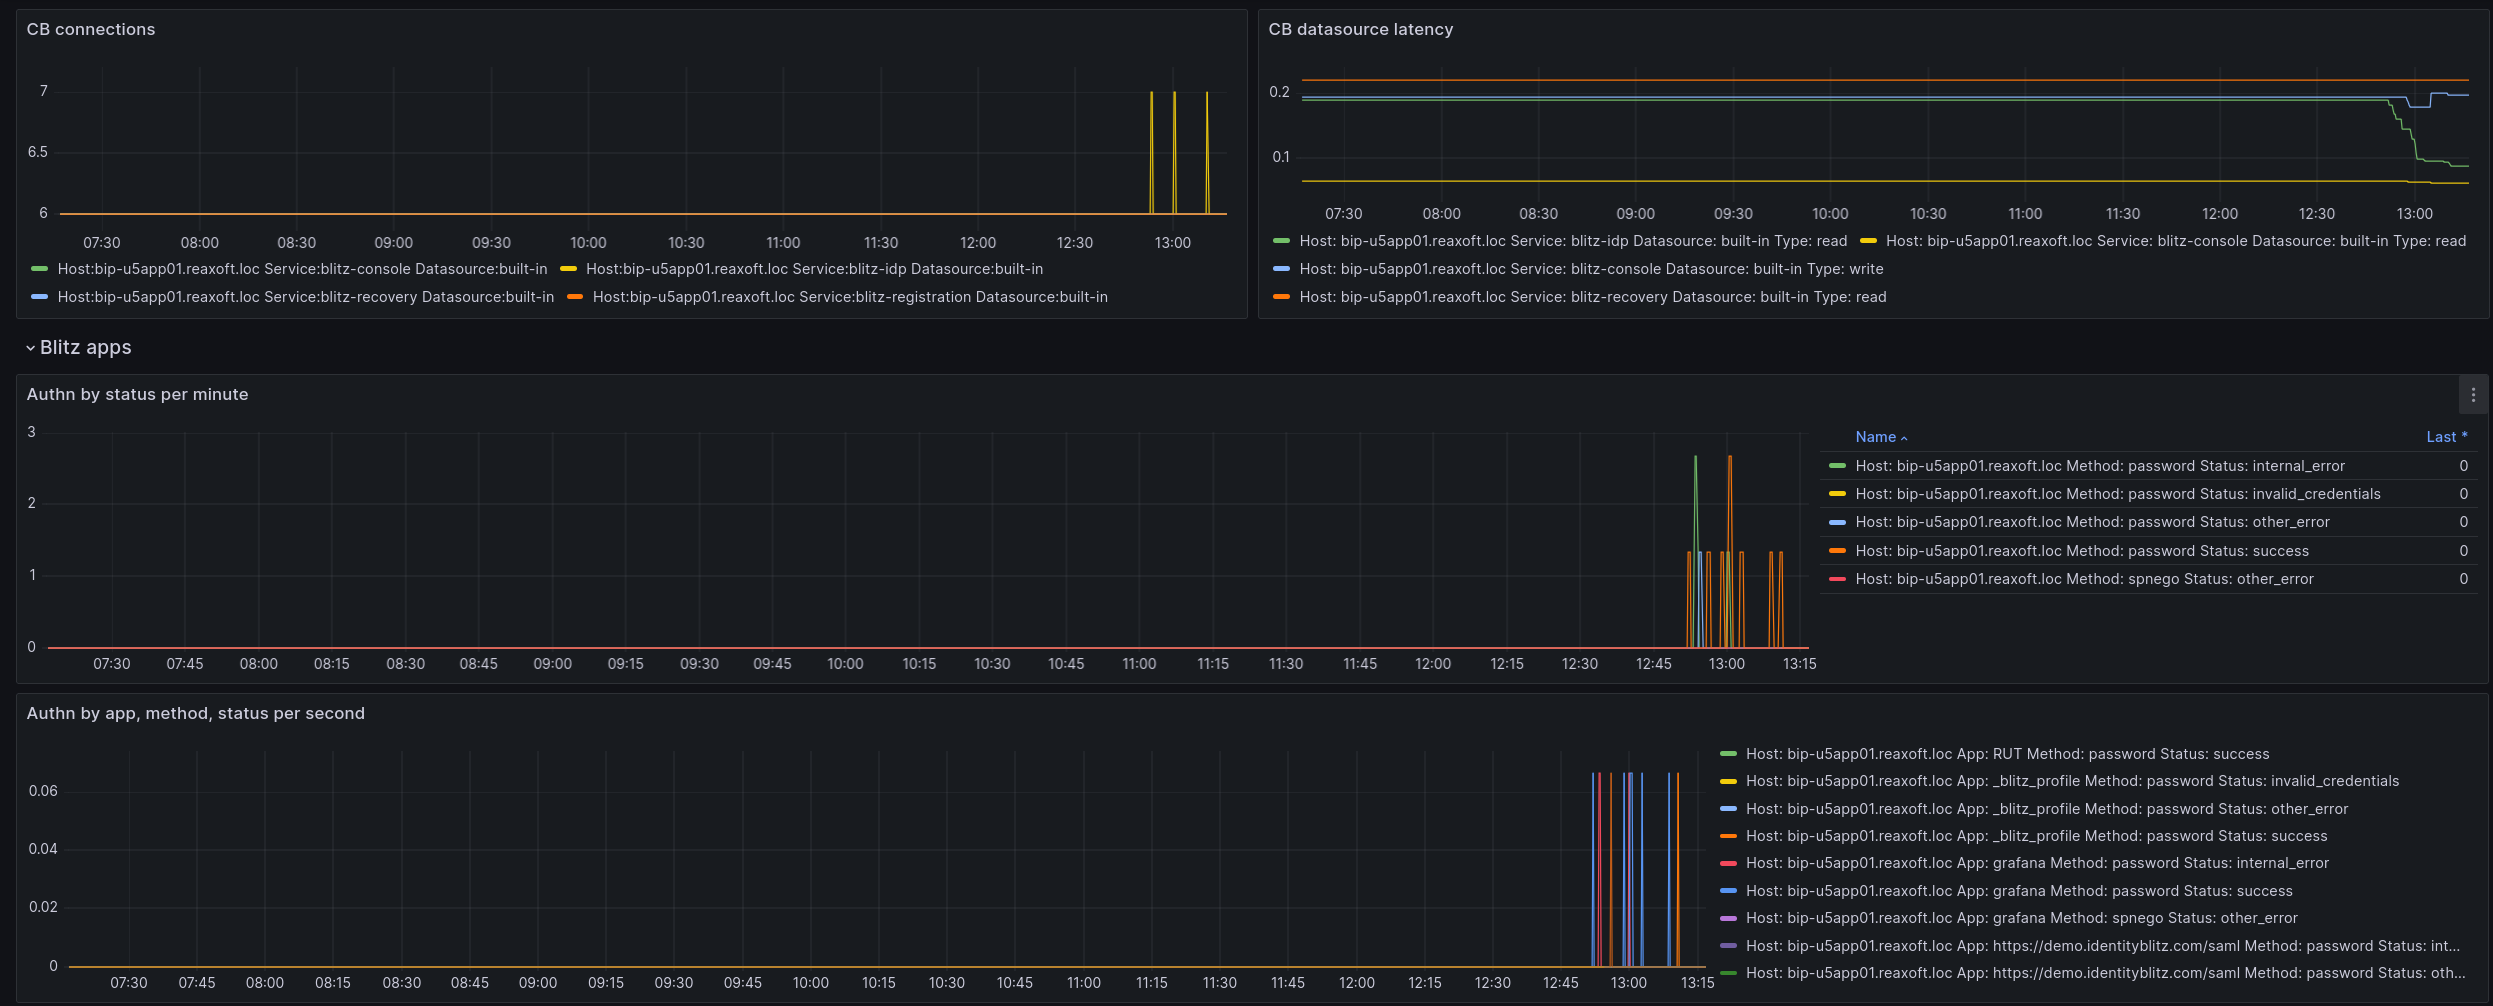
Using Grafana and Prometheus#
For quick setup of monitoring and visualization of Blitz Identity Provider processes, it is convenient to use the Prometheus job assignment and the Grafana dashboard template included in the delivery (resources.zip).
Tip
The visual representation of data has a wide range of applications. It can be used by managers to analyze workflows, engineers to track situations when the number of authentications exceeds a threshold value (alerts are configured), to monitor the validity of a license, etc. When updating, it is convenient to track the versions of services on a large number of hosts and the time of their launch.
To set up the visualization, follow these steps:
Modify the job assignment
prometheus.yamlaccording to your system configuration and add it to Prometheus.Modify the dashboard template
blitz-dashboard.json. Set up Grafana and add a dashboard.
Examples of data visualization in Grafana: